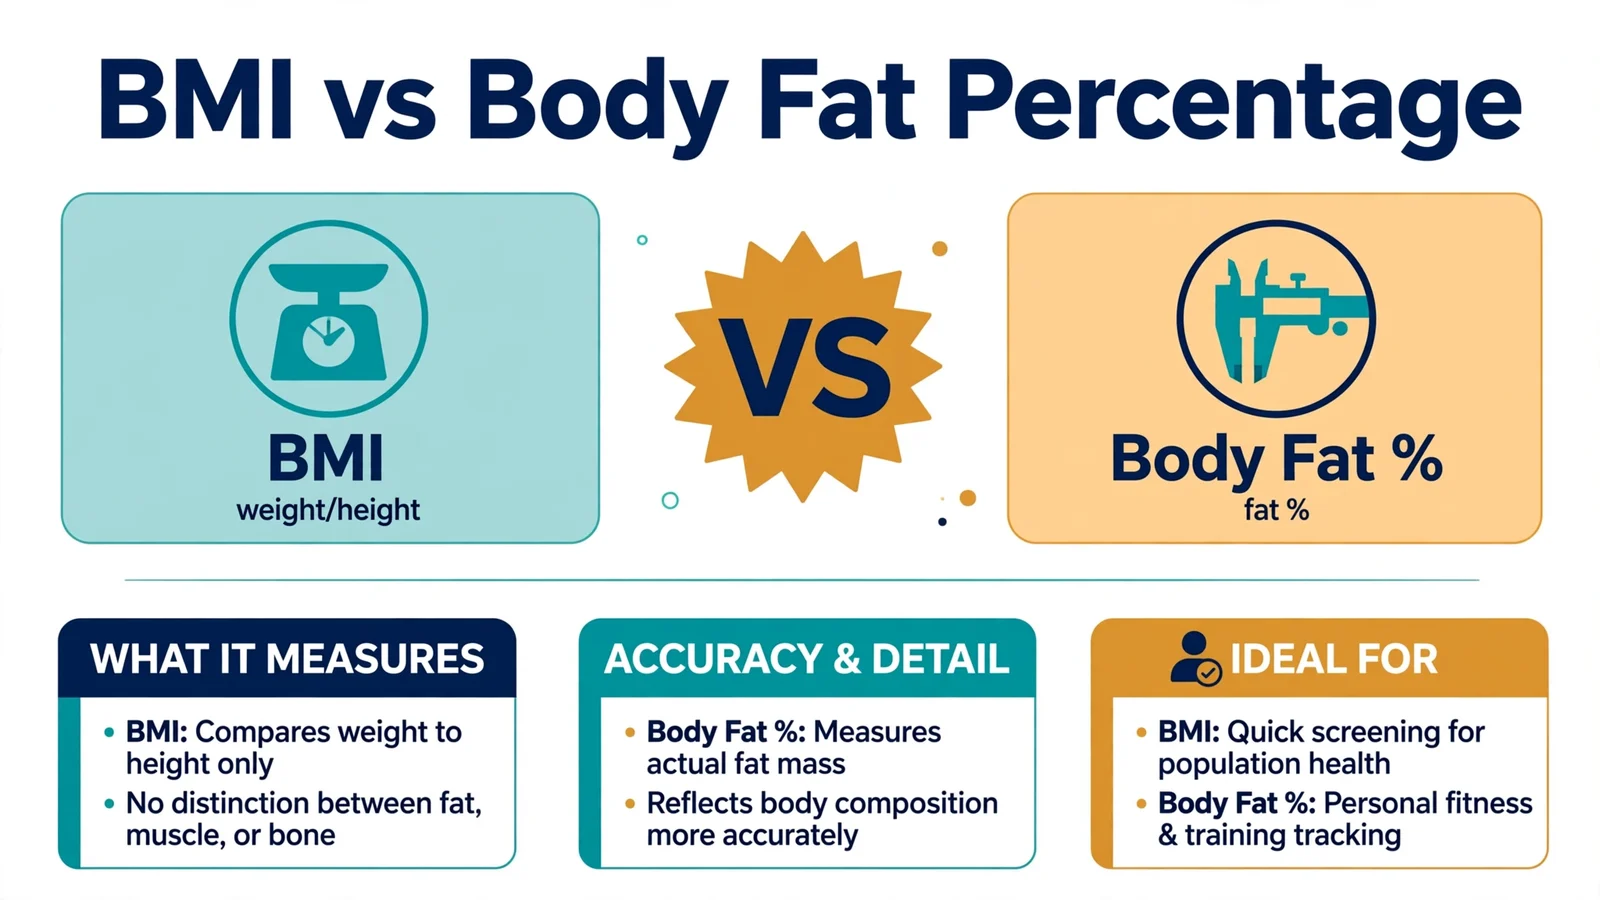
Body fat percentage is the better measure of actual body composition, but BMI is the better screening tool: free, instant, and good enough to flag risk. The honest answer is that you want both. BMI tells you whether your weight is in a healthy range for your height; body fat percentage tells you what that weight is made of. Here’s how they compare and when each one matters more.
What Is the Difference Between BMI and Body Fat Percentage?
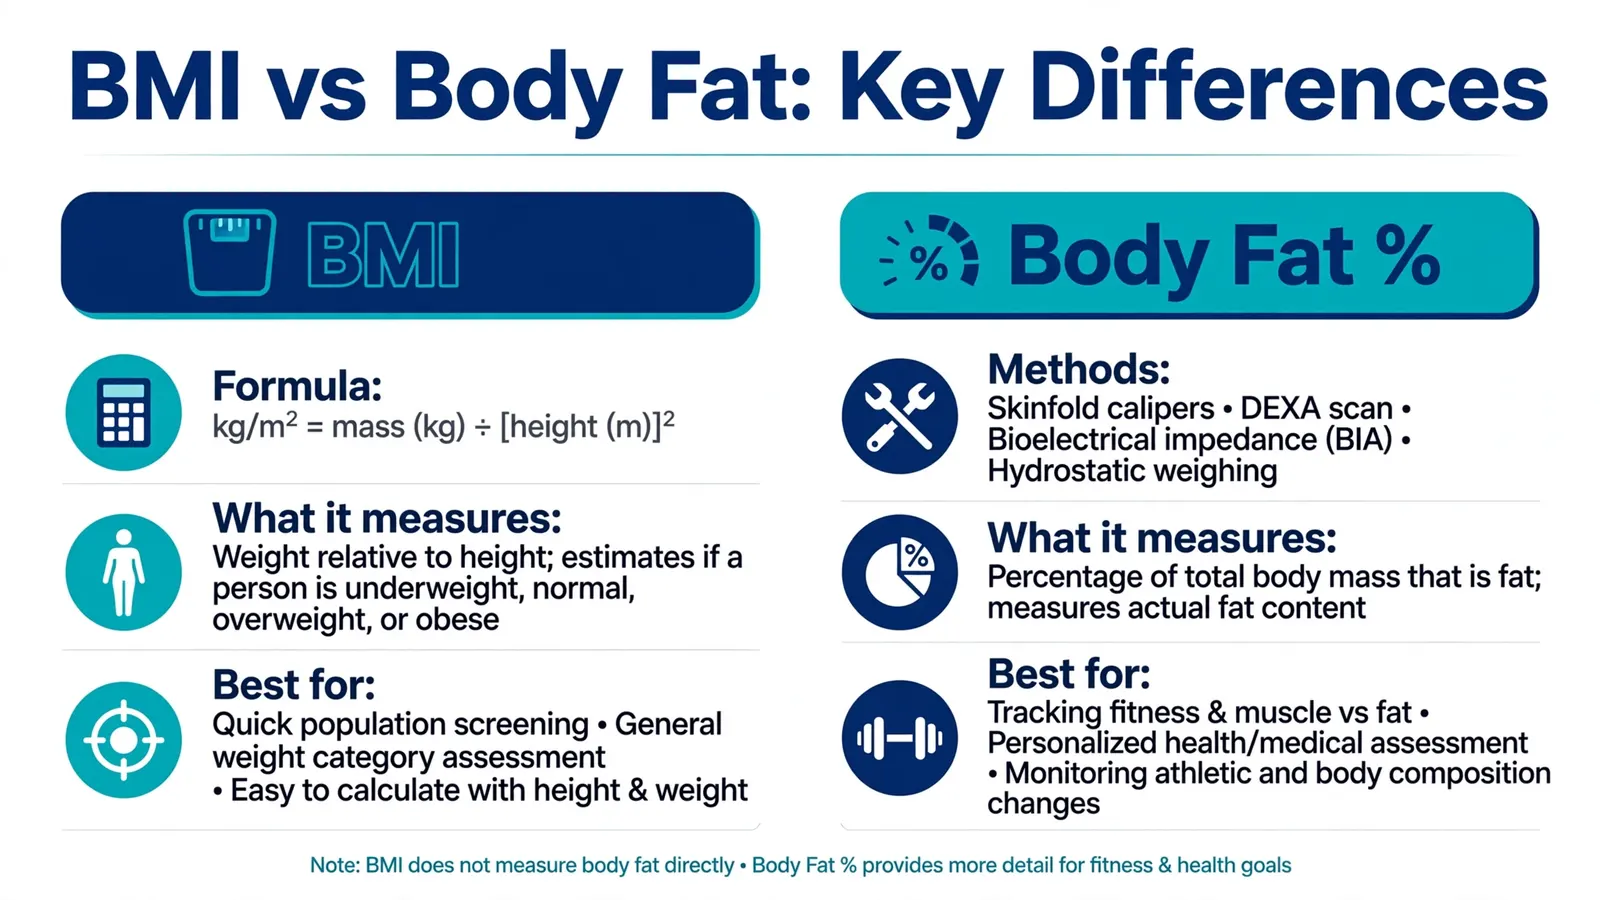
BMI (Body Mass Index) is a ratio of weight to height. It estimates body fat indirectly: BMI = weight (kg) / height (m)². It takes ten seconds and a scale.
Body fat percentage is the proportion of your total weight that is fat tissue. If you weigh 80 kg at 20 percent body fat, you carry 16 kg of fat and 64 kg of everything else (muscle, bone, water, organs). Unlike BMI, it measures the thing directly, but measuring it requires equipment or a professional.
The practical difference shows up immediately with real people. Take two men, both 5’10” and 200 pounds, both with a BMI of 28.7 (“overweight”). One is a rugby player at 12 percent body fat. The other is sedentary at 32 percent body fat. Same BMI, completely different bodies and health profiles. Body fat percentage sees the difference. BMI doesn’t.
How Is Body Fat Percentage Measured?
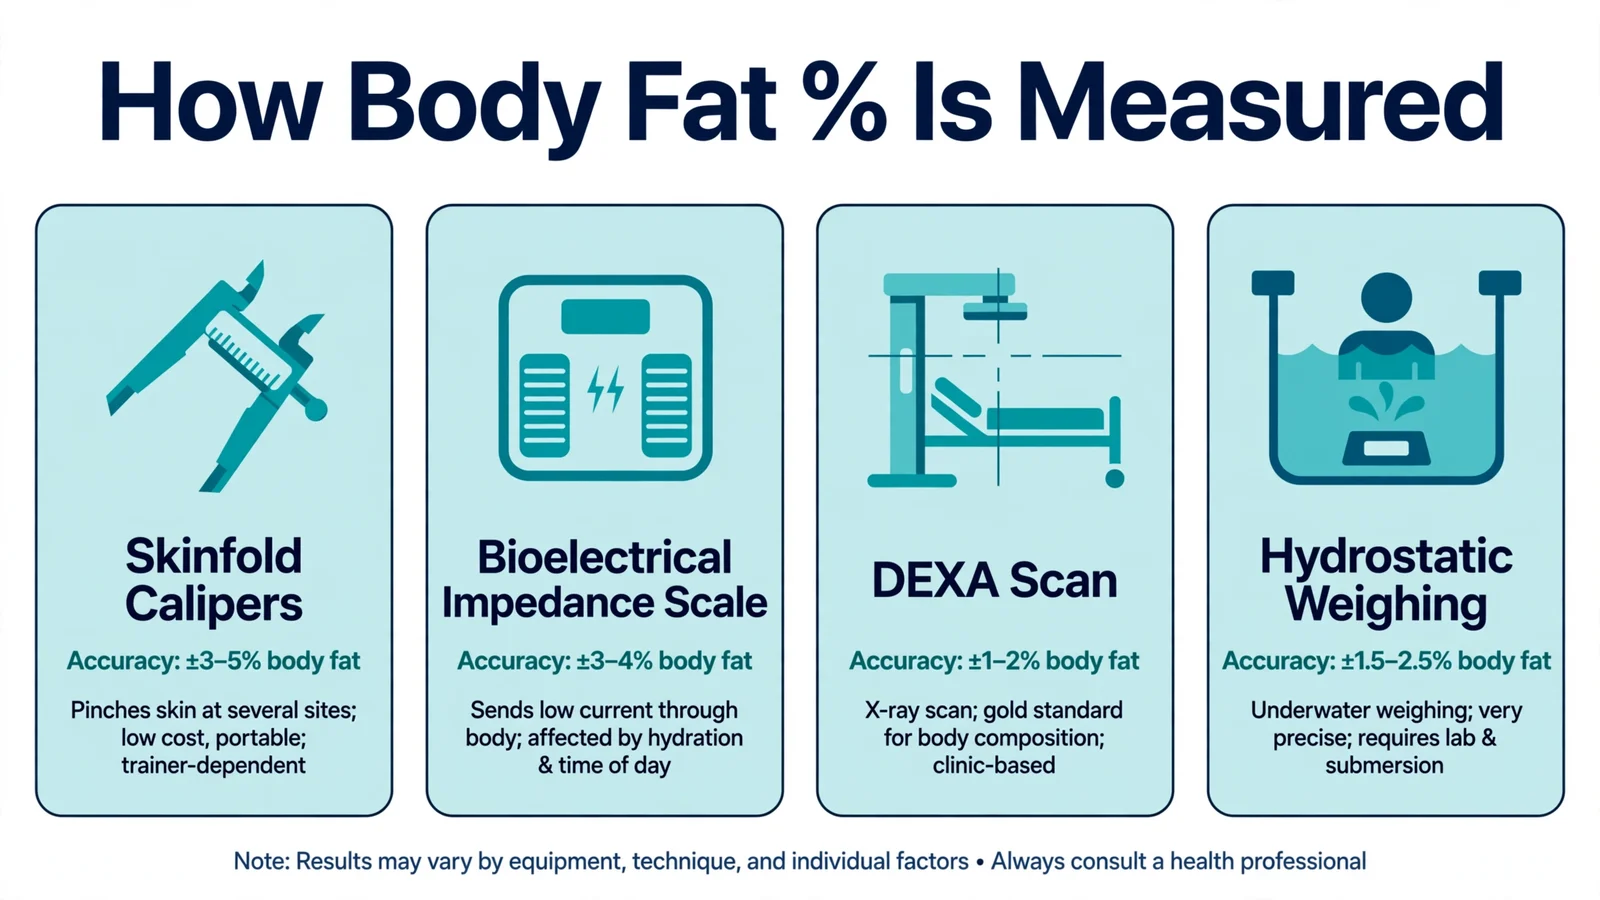
This is where body fat percentage loses points for convenience. Accuracy and accessibility trade off sharply across methods.
DEXA scan. The gold standard. A low dose X-ray scan that distinguishes fat, muscle, and bone precisely. Accurate within 1 to 2 percent. Downsides: costs money, requires a clinic visit, involves tiny radiation exposure.
Hydrostatic weighing. The old gold standard: you’re weighed underwater and body density reveals composition. Very accurate but deeply impractical. Almost nobody does this anymore outside research labs.
Bod Pod (air displacement). Similar principle to hydrostatic weighing but with air instead of water. Accurate and more comfortable, but still requires a specialized facility.
Bioelectrical impedance (smart scales and handheld devices). Sends a tiny electrical current through your body; fat resists more than muscle. Convenient and cheap, but accuracy swings wildly with hydration, recent meals, exercise, and even skin temperature. Treat the trend as useful, the absolute number as approximate.
Skinfold calipers. A trained person pinches your skin at several sites and plugs the measurements into a formula. Cheap and reasonably accurate (within 3 to 4 percent) in skilled hands, unreliable in unskilled ones.
Navy method (tape measure). Uses neck, waist, and hip measurements in a formula developed by the US Navy. Free, decent estimates, but still an estimate.
Visual estimation. Comparing yourself to reference photos. Free and instant, accurate to maybe plus or minus 5 percent if you’re honest. Better than nothing.
Notice the pattern: the accurate methods are expensive or inconvenient, and the convenient methods are approximate. BMI’s superpower is that it’s both free and instant, even if it’s rougher.
What Are Healthy Body Fat Percentage Ranges?
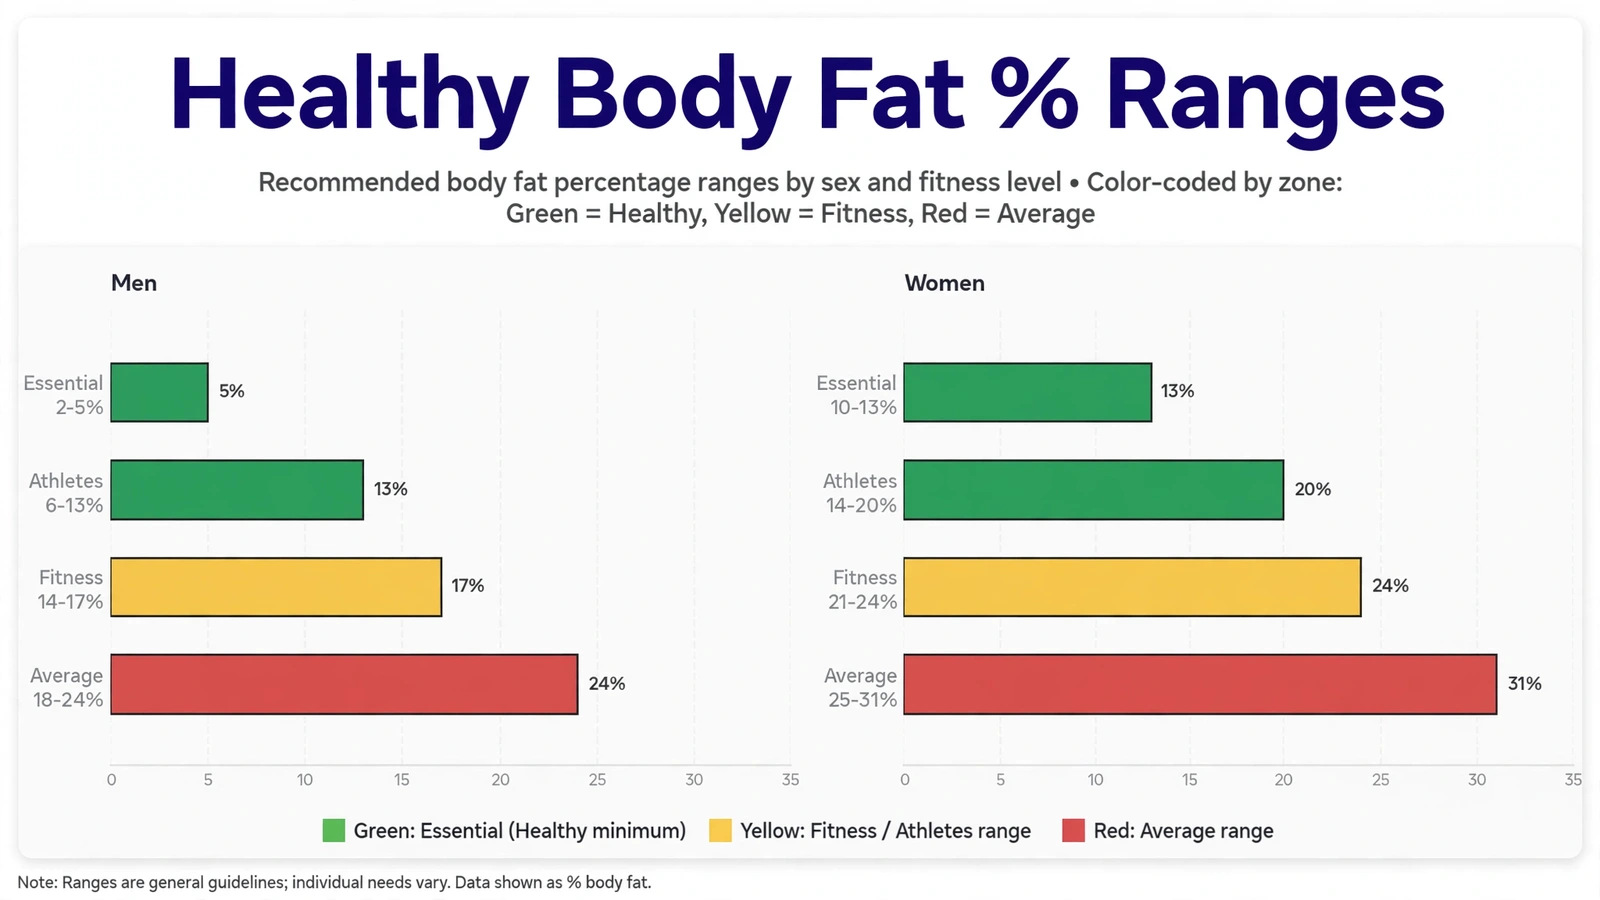
Unlike BMI’s single universal chart, healthy body fat ranges differ by sex and age. Here are the widely used American Council on Exercise (ACE) categories:
Men:
| Category | Body Fat % |
|---|---|
| Essential fat | 2-5% |
| Athletes | 6-13% |
| Fitness | 14-17% |
| Average | 18-24% |
| Obese | 25%+ |
Women:
| Category | Body Fat % |
|---|---|
| Essential fat | 10-13% |
| Athletes | 14-20% |
| Fitness | 21-24% |
| Average | 25-31% |
| Obese | 32%+ |
Women’s healthy ranges run higher because essential fat includes breast tissue and reproductive system fat. These aren’t arbitrary: dropping below essential fat levels disrupts hormones, immunity, and organ function.
For comparison, the “healthy” BMI range of 18.5 to 24.9 roughly corresponds to the “fitness” through “average” body fat bands for most people, but the mapping is loose. That’s exactly why the two metrics complement each other rather than compete.
When Is BMI the Better Choice?
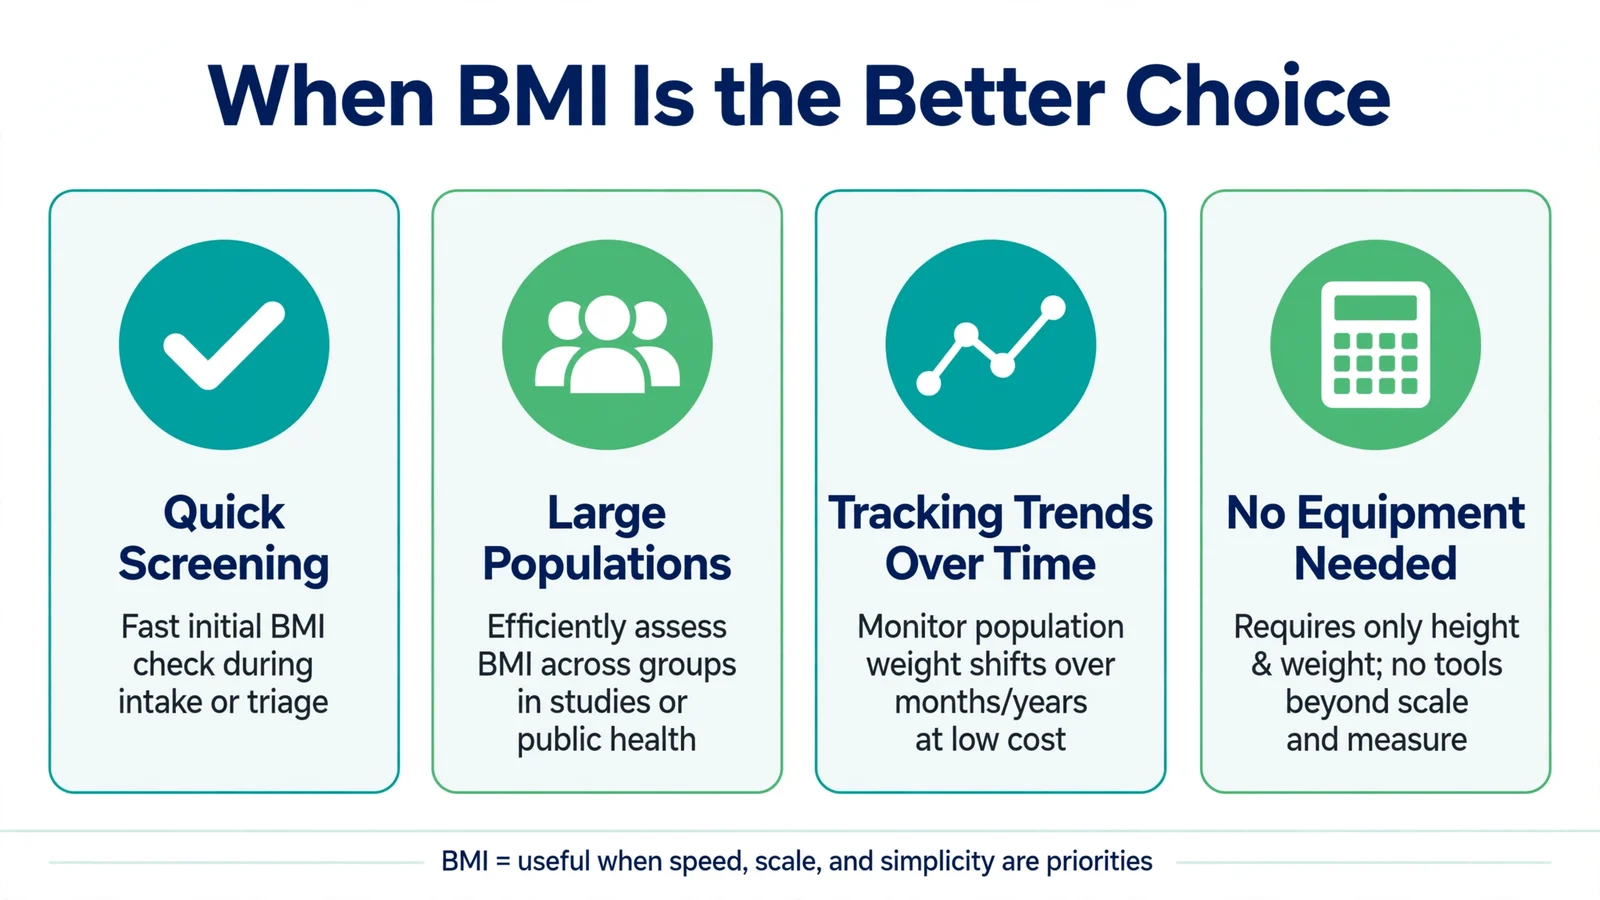
BMI wins in specific situations, and they’re common ones.
Quick screening. Doctor’s office, insurance forms, population studies, or a first check at home. When you need a fast, zero cost signal, BMI delivers.
Tracking weight trends. If your activity level and muscle mass are fairly stable, BMI trend over months is a perfectly good weight tracker. The number going from 28 to 25 means real progress, whatever the composition details.
When precision tools aren’t available. No calipers, no smart scale, no clinic nearby? BMI plus a tape measure around your waist gets you 80 percent of the insight for zero cost.
For public health and research. BMI’s simplicity is why decades of epidemiological data exist. Those risk curves linking BMI to disease are genuinely valuable, even if individual application needs nuance.
BMI is the better choice when speed, cost, or comparability matter most.
When Is Body Fat Percentage the Better Choice?
Body fat percentage wins whenever composition actually matters, which is most personal health decisions.
Athletes and muscular individuals. If you train seriously, BMI is close to useless for you. Body fat percentage tells you whether your training and diet are actually changing composition or just moving weight around.
“Skinny fat” assessment. Normal BMI but soft midsection and low muscle? That’s normal weight obesity, and only body fat percentage (or a careful eye plus waist measurement) reveals it. BMI will tell you everything’s fine while metabolic risk quietly builds.
Tracking recomposition. If you’re simultaneously losing fat and gaining muscle (common for beginners lifting weights), scale weight and BMI may barely move while your body transforms. Body fat percentage captures progress that BMI completely misses. This is the number one reason people quit: the scale lies during recomposition, and body fat percentage tells the truth.
Setting precise goals. “Get to 15 percent body fat” is a clearer, more meaningful target than “get to BMI 23” for anyone who cares about how they look and perform, not just what they weigh.
Older adults. With age related muscle loss, BMI becomes increasingly misleading. An older adult at BMI 24 could be sarcopenic obese (low muscle, high fat). Body fat percentage plus a strength assessment gives the real picture.
Can You Use Both Together?
Absolutely, and you should. They’re not rivals; they’re a team.
The simplest effective protocol: calculate your BMI monthly with our free BMI calculator, measure your waist at the same time, and check body fat percentage quarterly (even with an inexpensive smart scale, watching the trend). This trio costs almost nothing and catches everything important.
Here’s how to read the combinations:
- Healthy BMI + healthy body fat: You’re in great shape. Maintain.
- Healthy BMI + high body fat: Normal weight obesity. Focus on strength training and protein, not just weight loss.
- High BMI + healthy body fat: You’re muscular. Ignore BMI; track body fat and performance.
- High BMI + high body fat: Classic overweight/obesity. A moderate calorie deficit plus movement is the play; our calorie calculator can set your target.
One number screens. Two numbers diagnose. Three numbers (adding waist) give you a genuinely complete picture that rivals what most clinic visits provide.
Frequently Asked Questions
What is a good body fat percentage for my age?
Healthy ranges shift slightly with age as muscle naturally declines. For men, staying under 25 percent is the general target at any age; for women, under 32 percent. Athletes and fit individuals of any age typically sit much lower. Age specific charts exist, but these broad cutoffs work well as targets.
Can BMI and body fat percentage disagree?
Constantly. Muscular people get high BMI with low body fat; sedentary people get normal BMI with high body fat (“skinny fat”). The two metrics disagree most in exactly the cases where body fat percentage is more informative, which is why pairing them matters.
How do I lower my body fat percentage without losing muscle?
Keep protein high (1.6 to 2.2 grams per kilogram daily), lift weights 2 to 4 times weekly, and maintain only a moderate calorie deficit (300 to 500 calories). Aggressive deficits burn muscle along with fat. Patience preserves lean mass.
Is a smart scale body fat reading accurate?
Approximately, not precisely. Consumer bioimpedance scales can be off by 3 to 8 percent versus DEXA, and readings swing with hydration and meal timing. Use one scale, measure under consistent conditions (morning, fasted), and trust the multi week trend rather than any single reading.
What body fat percentage is considered obese?
Generally 25 percent or higher for men and 32 percent or higher for women, per American Council on Exercise standards. These thresholds align roughly with the health risks seen at BMI 30+, but they describe composition directly rather than through the proxy of weight.
Should I track BMI or body fat percentage for weight loss?
Track both, plus waist circumference. BMI shows overall weight trend, body fat percentage shows whether you’re losing fat (not muscle), and waist shows whether dangerous abdominal fat is shrinking. Together they tell you what’s actually happening; alone, each can mislead.
Conclusion
Body fat percentage is the better measure of what your body is actually made of, and BMI is the better tool for quick, free screening. Neither one alone tells the full story, but together, especially with a waist measurement added, they give you a remarkably complete picture of your body composition and health risk.
Start simple: get your baseline with our free BMI calculator right now, then consider adding body fat tracking to the mix. If fat loss is the goal, our calorie calculator will help you set a daily target that preserves muscle while the fat comes off.
The American Council on Exercise publishes the standard body fat percentage categories referenced above, and the CDC’s BMI pages explain how the two metrics fit together in practice.