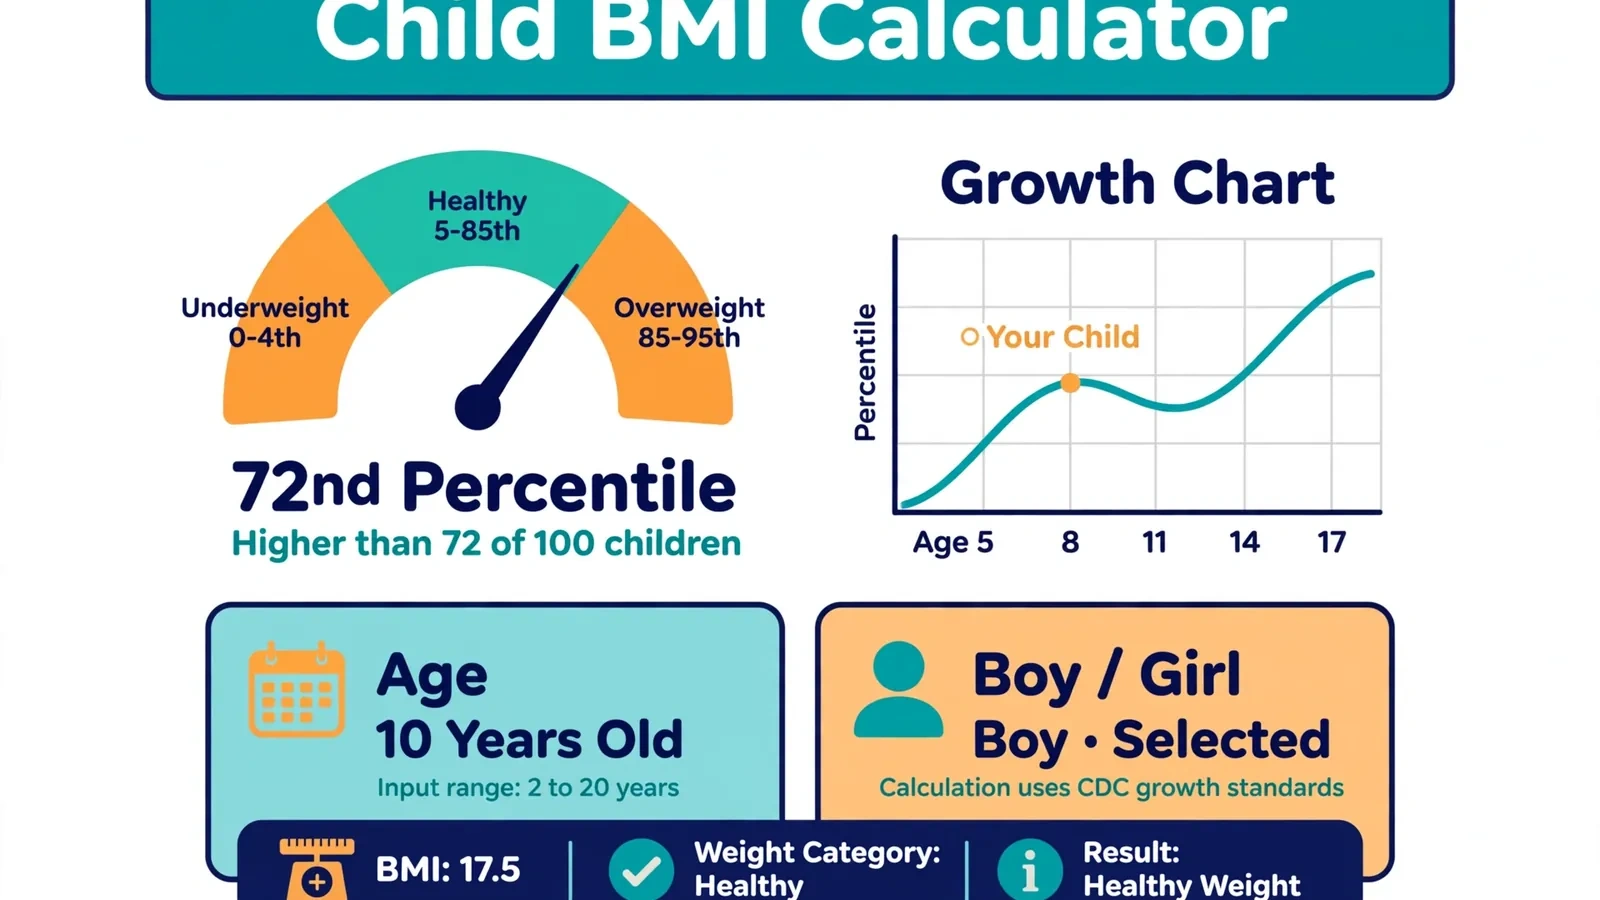
A child BMI calculator takes your child’s weight, height, age, and sex, then converts those numbers into a BMI-for-age percentile using CDC or WHO growth charts. Unlike adult BMI, which uses fixed cutoffs like 25 and 30, a child’s result is a percentile showing where their BMI sits compared to other children of the same age and sex.
That difference surprises many parents. A BMI of 19 means one thing for a 35 year old and something entirely different for a 10 year old. This guide explains how it works, what the percentile categories mean, which growth charts doctors trust, and what to do with the result. For grown ups, our adult BMI calculator uses the standard adult cutoffs instead.
What Is a Child BMI Calculator?
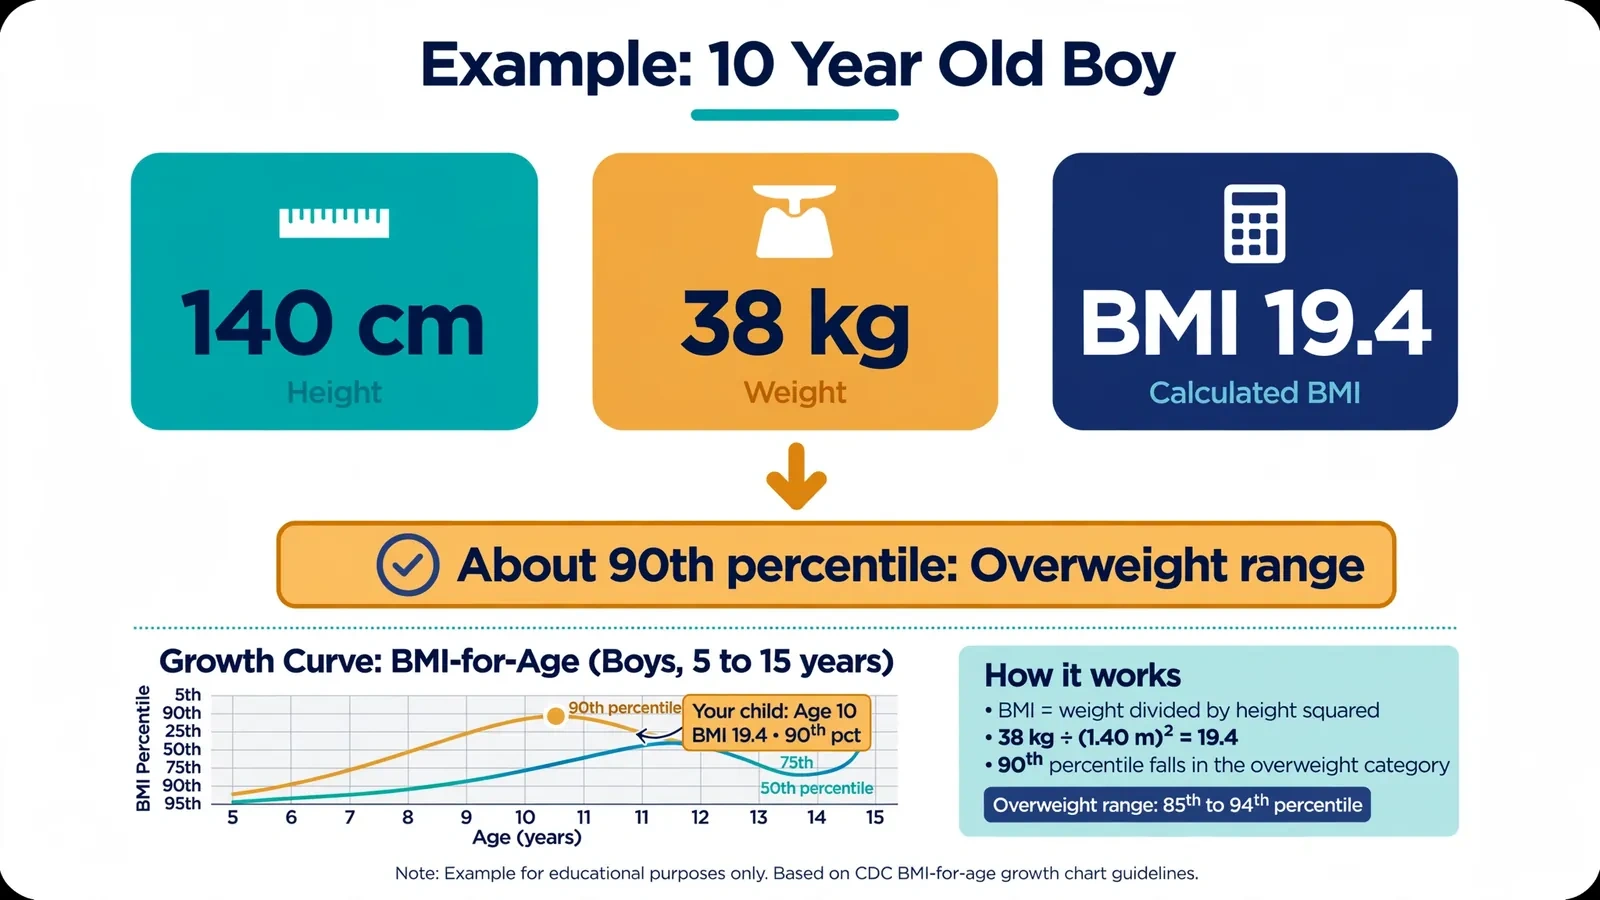
A child BMI calculator starts with the same math as the adult version: weight in kilograms divided by height in meters squared. The difference is what happens next. Instead of fixed cutoffs, the result is plotted on an age- and sex-specific growth chart, which returns a percentile.
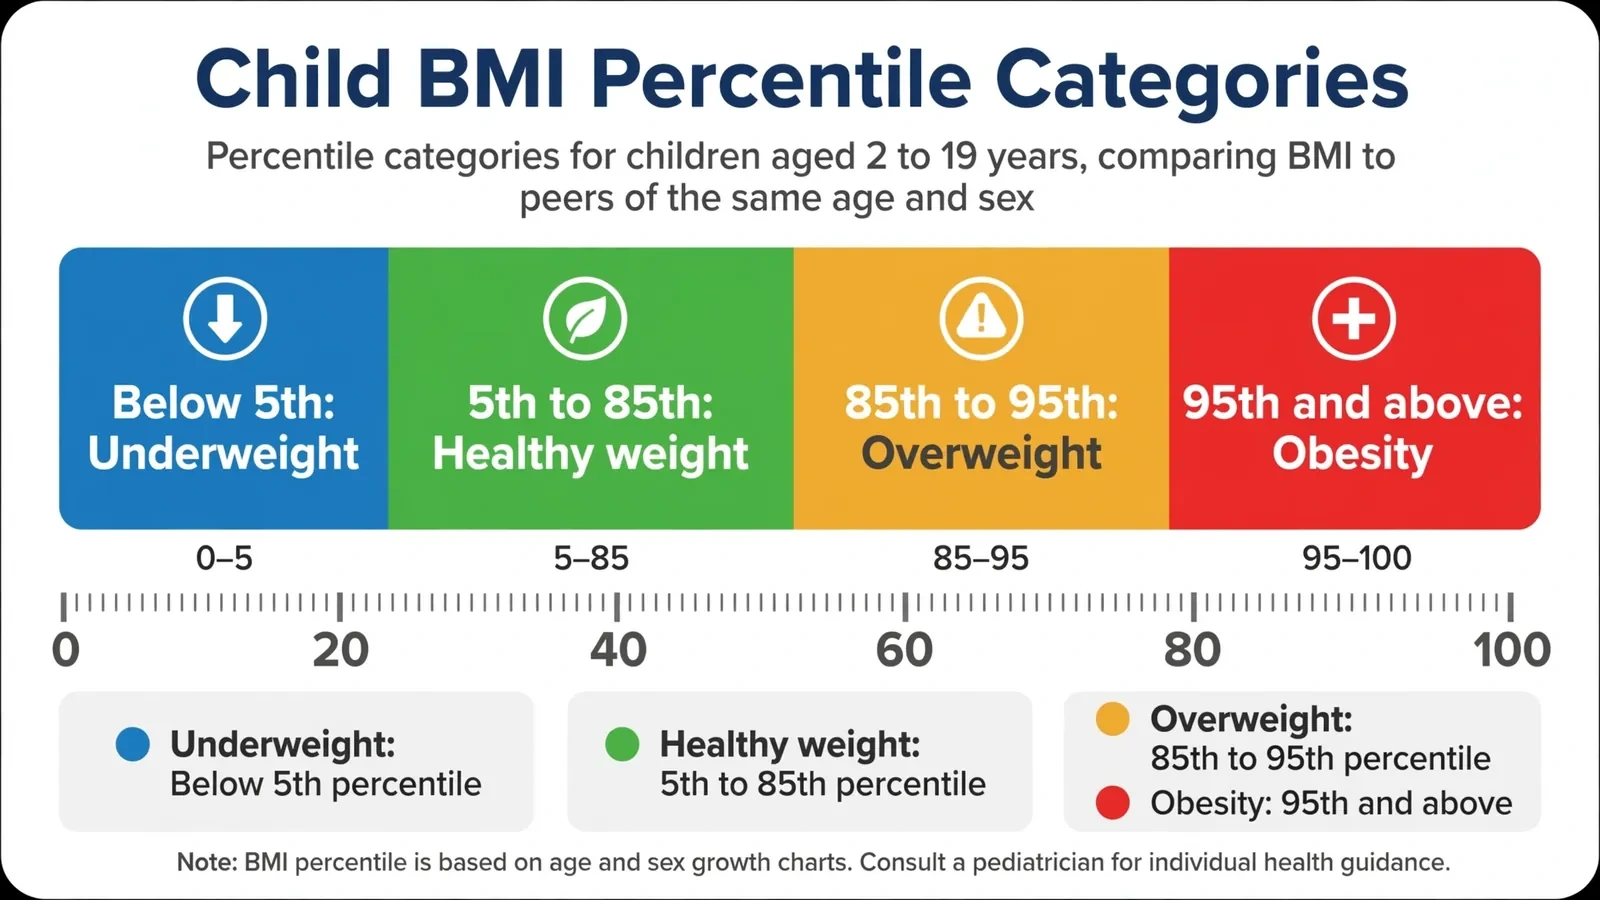
A child BMI calculator computes BMI from weight and height, then plots it on an age- and sex-specific growth chart to produce a BMI-for-age percentile. CDC categories for ages 2 to 19: underweight below the 5th percentile, healthy weight from the 5th to below the 85th, overweight from the 85th to below the 95th, obesity at or above the 95th.
The percentile is the whole point. A child in the 70th percentile has a higher BMI than about 70 percent of same-age, same-sex children. It is a comparison, not a grade.
How Is Child BMI Different From Adult BMI?
Three differences explain why children need their own calculator. First, children are growing. A healthy BMI for a 6 year old is lower than for a 14 year old, because body composition changes with growth. Fixed adult cutoffs would mislabel huge numbers of healthy children, so the CDC and WHO built percentile curves from measurements of thousands of children instead.
Second, sex matters. Boys and girls follow different growth patterns, especially around puberty. A child BMI calculator asks for sex because the reference charts are sex-specific; the same BMI can land in different percentiles for a boy and girl of the same age.
Third, the formula is only step one. For adults, BMI = kg/m2 is nearly the whole story. For children, that number is just the input to the percentile lookup. Two children with identical BMIs but different ages get different percentiles.
One boundary to know: BMI-for-age charts cover ages 2 to 19. Under age 2, doctors use weight-for-length charts instead, since BMI is not validated for infants and toddlers.
What Do Child BMI Percentiles Mean?
The CDC defines four weight status categories for ages 2 to 19, based on BMI-for-age percentile:
| Percentile | Weight status | What it means |
|---|---|---|
| Below the 5th | Underweight | Below the healthy range; talk to your pediatrician |
| 5th to below 85th | Healthy weight | Within the expected range for age and sex |
| 85th to below 95th | Overweight | Above the healthy range; a lifestyle review is wise |
| 95th and above | Obesity | Well above the range; medical guidance recommended |
Two caveats: near a boundary, the gap between the 84th and 86th percentile is just measurement noise. And one reading is a snapshot; the trend across checkups tells you far more.
How Do Parents Use a Child BMI Calculator?
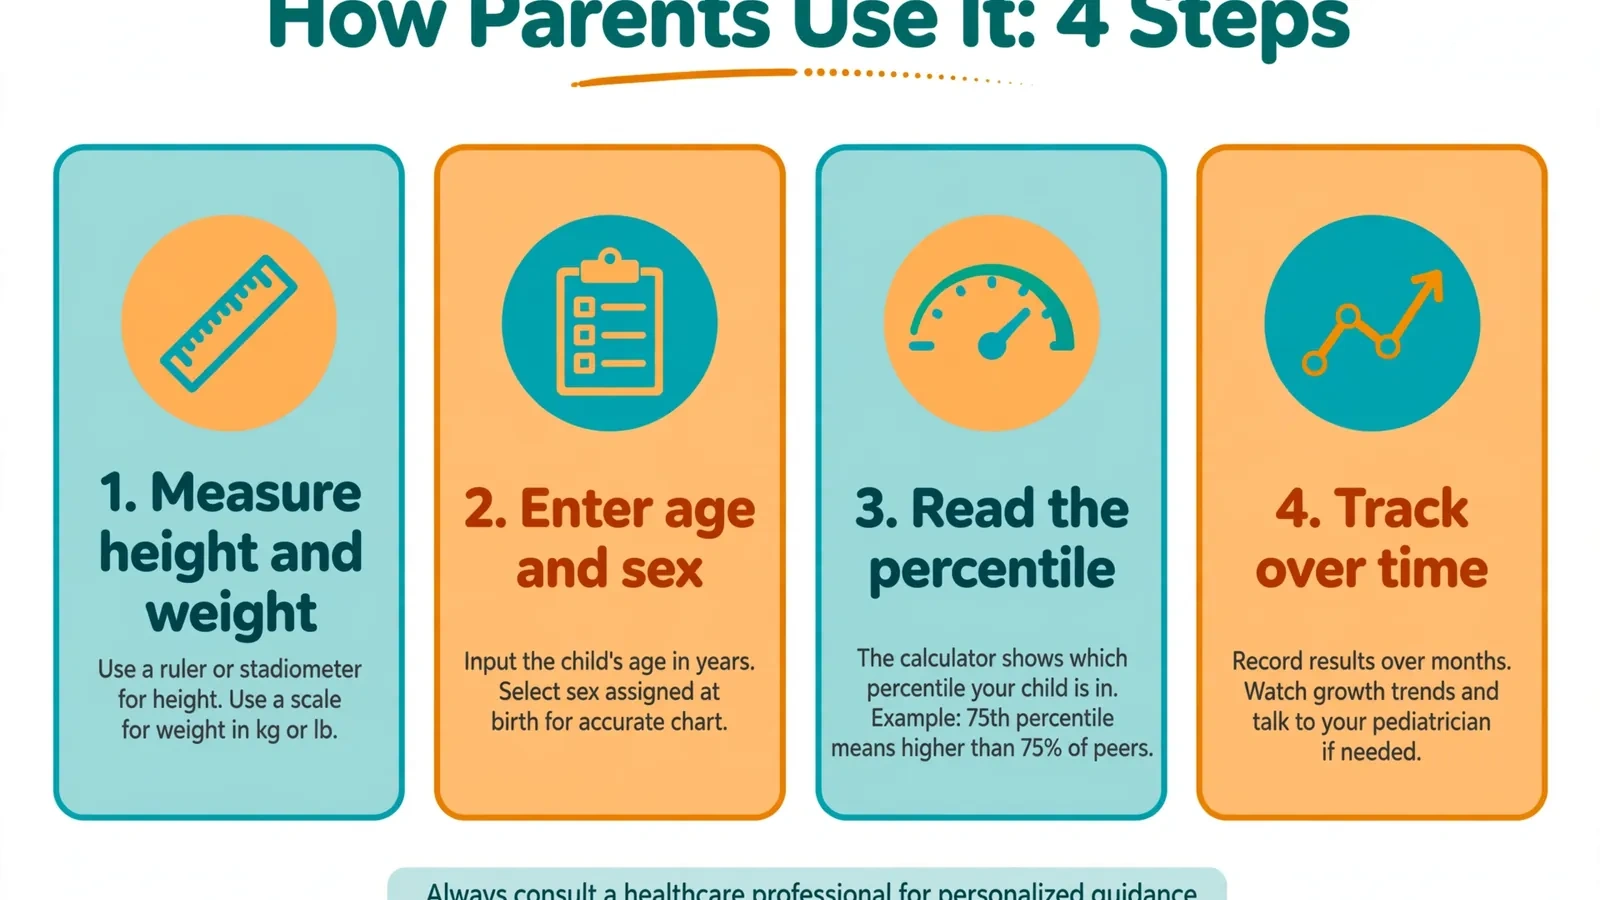
Careful measuring matters: small errors shift percentiles noticeably in small bodies.
1. Measure height precisely. Barefoot against a wall, heels together, eyes straight ahead. Mark the top of the head and measure to the mark. Even a centimeter of slouch changes the result.
2. Weigh in light clothing. Morning weight, after the bathroom and before breakfast, is the most consistent. Use a digital scale on a hard floor.
3. Enter exact age and sex. Age in years and months beats whole years, since charts move fast during growth spurts. Pick the correct sex, because the reference curves differ.
4. Read the percentile, not the BMI. The BMI number alone says almost nothing for a child. The percentile and its category are the real result.
5. Track it over time. Log date, height, weight, and percentile every few months. A steady upward drift across percentile lines deserves attention sooner than a flat line at the 88th. That log gives your pediatrician a usable trend.
Which Growth Charts Do Doctors Use: CDC or WHO?
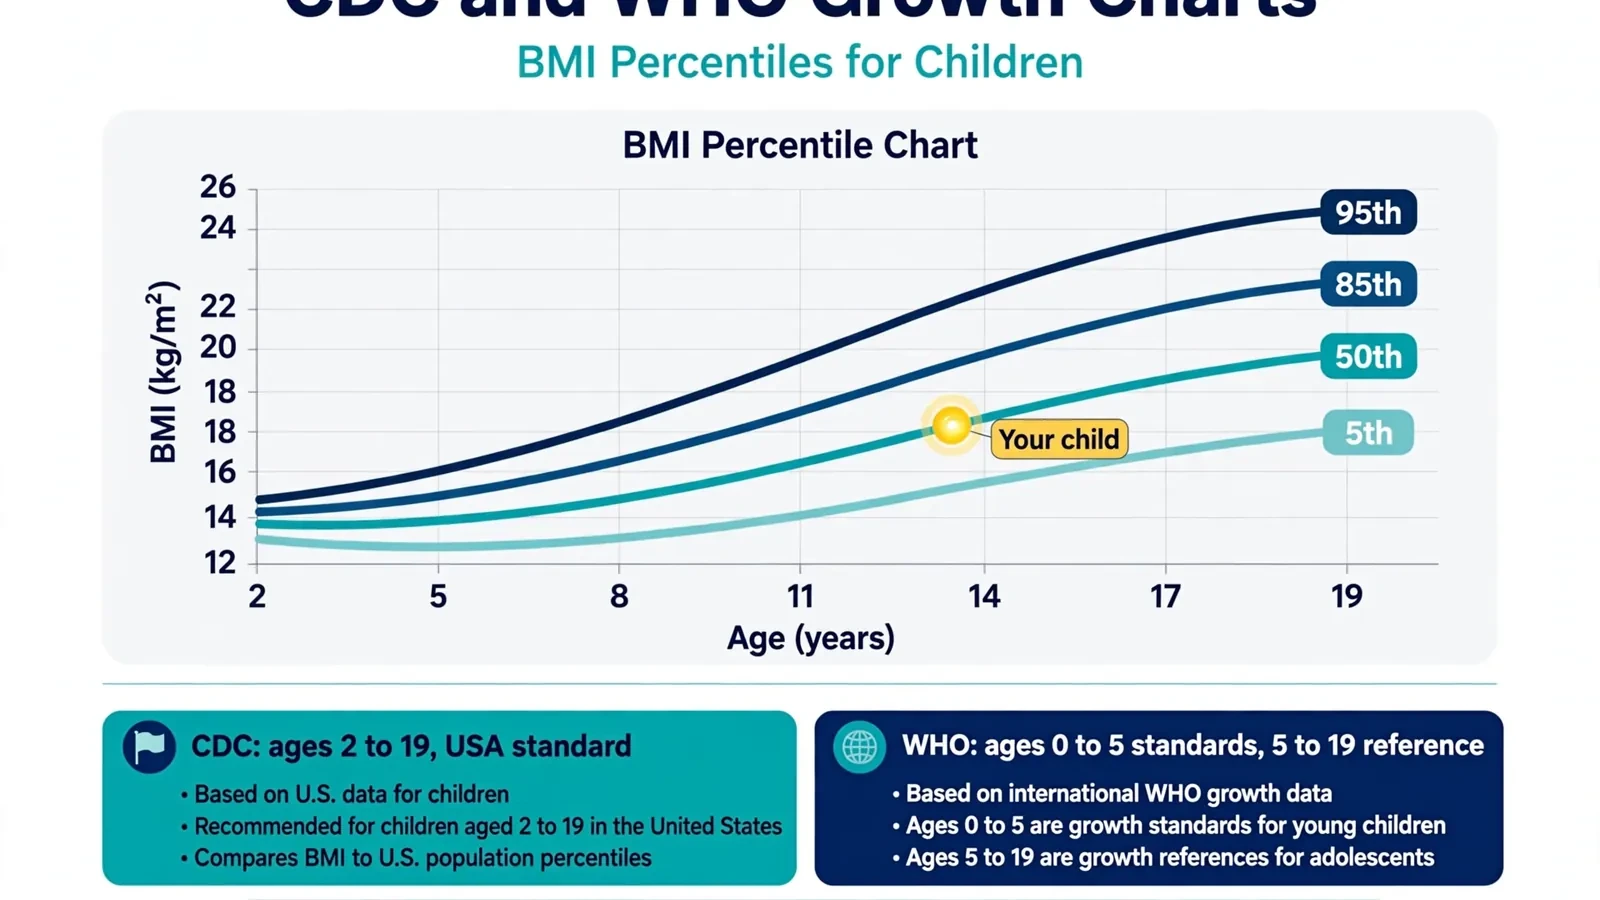
It depends on location and age. Both are authoritative; they cover different populations.
The CDC growth charts are the US standard for ages 2 to 19, built from US population data, and they define the percentile categories most American pediatricians use. The World Health Organization publishes the Child Growth Standards for ages 0 to 5, based on breastfed children in six countries, plus a Growth Reference for ages 5 to 19 used widely outside the US.
In practice the two systems agree for most children. The categories in the table above are the CDC’s, which is also what the BMI calculator tools most parents find online tend to follow. If your pediatrician uses WHO charts, the interpretation logic is identical; only the reference curves differ slightly.
What Should I Do If My Child’s BMI Percentile Is High?
First, do not panic, and do not put your child on a diet. A high percentile is a prompt for a pediatrician conversation, not a verdict. Restrictive eating can harm a growing child’s health and relationship with food.
Start with habits the whole family can share: the CDC recommends 60 minutes of daily activity for ages 6 to 17. Swap sugary drinks for water, keep regular mealtimes, and protect sleep, since short sleep is linked to extra weight gain in children.
Second, book the pediatrician visit. They will review the growth trend, rule out medical causes, and check markers like blood pressure. If action is needed, they may suggest a family-based lifestyle program, which evidence supports far more than any diet imposed on a child.
Third, model the change yourself, since children copy what they see. Many parents check their own numbers too: our adult BMI calculator covers grown ups, and the Harris Benedict formula page explains daily calorie needs. A calorie calculator can also give a realistic sense of family meal portions, though a child’s exact needs are best fine tuned with a pediatrician.
Frequently Asked Questions
How does a child BMI calculator work?
It calculates BMI from weight and height, then looks it up on an age- and sex-specific growth chart to find the percentile. That percentile places the child in a CDC category: underweight, healthy weight, overweight, or obesity. Without age and sex, the percentile cannot be determined.
What is a healthy BMI percentile for a child?
The CDC defines healthy weight as the 5th percentile to below the 85th. Most children sit somewhere in this wide band, and the exact position matters less than a stable trend over time.
At what age should I start tracking my child’s BMI?
BMI-for-age charts start at age 2, the earliest meaningful point. Before that, pediatricians use WHO weight-for-length charts. Annual checkups are a natural tracking rhythm after age 2.
Can a child be in a high percentile and still be healthy?
Yes. Muscular, athletic kids can plot in the overweight range without excess body fat, and children near a boundary may just reflect normal variation. A pediatrician weighing the growth trend, diet, activity, and family history can tell the difference.
Do boys and girls use the same BMI chart?
No. The CDC and WHO publish separate BMI-for-age charts for boys and girls because growth patterns differ, especially during puberty. A good child BMI calculator always asks for sex and applies the matching chart.
Should children diet to lower their BMI percentile?
No, not without medical guidance. Restrictive dieting in childhood risks nutrient deficiencies and disordered eating. The recommended path is family-wide healthy habits: daily activity, fewer sugary drinks, regular meals, and enough sleep, guided by your pediatrician.
Conclusion
A child BMI calculator answers a different question than the adult version: not “what is my BMI category,” but “where does my child’s BMI sit among peers of the same age and sex.” The percentile, read from CDC or WHO growth charts, is the result that matters, and the trend across checkups matters more than any single reading.
If your child’s percentile falls outside the healthy range, treat it as useful information, not a crisis. Track the trend, build active family habits, and bring the numbers to your pediatrician. For reference, the CDC’s BMI calculator for child and teen uses these exact charts, and the WHO child growth standards page documents the international references.